

Should you trust an object detector’s confidence?
An object detector draws a box around an object, names it, and gives it a confidence score. A score of 0.90 sounds like a 90% chance of being right. But does the detector actually get about nine out of ten similar predictions right? That can be checked against labeled images.
The chart below compares average confidence with the share of correct detections. When the two bars line up, the average score agrees with the results. A shorter confidence bar means the model is too cautious on average. A taller one means it is too confident. Averages alone do not prove that every score range is reliable.
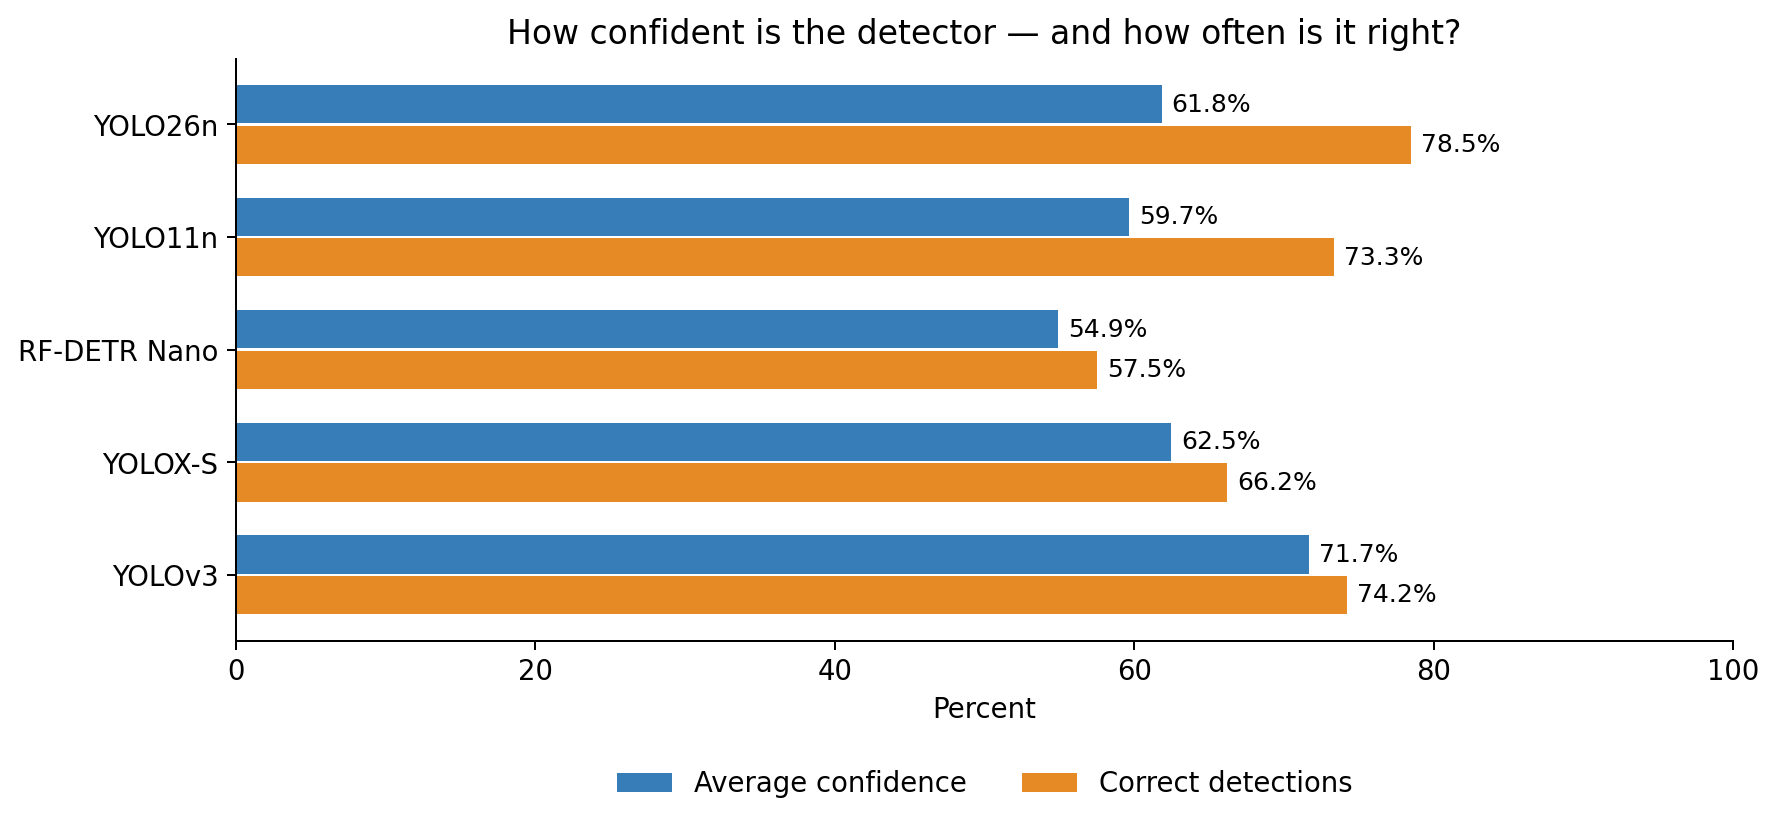
For YOLO26n, average confidence was 61.81%, but 78.45% of its detections were correct. Its scores were too low on average. A small correction can make those scores more useful without changing a single box.
What calibration means
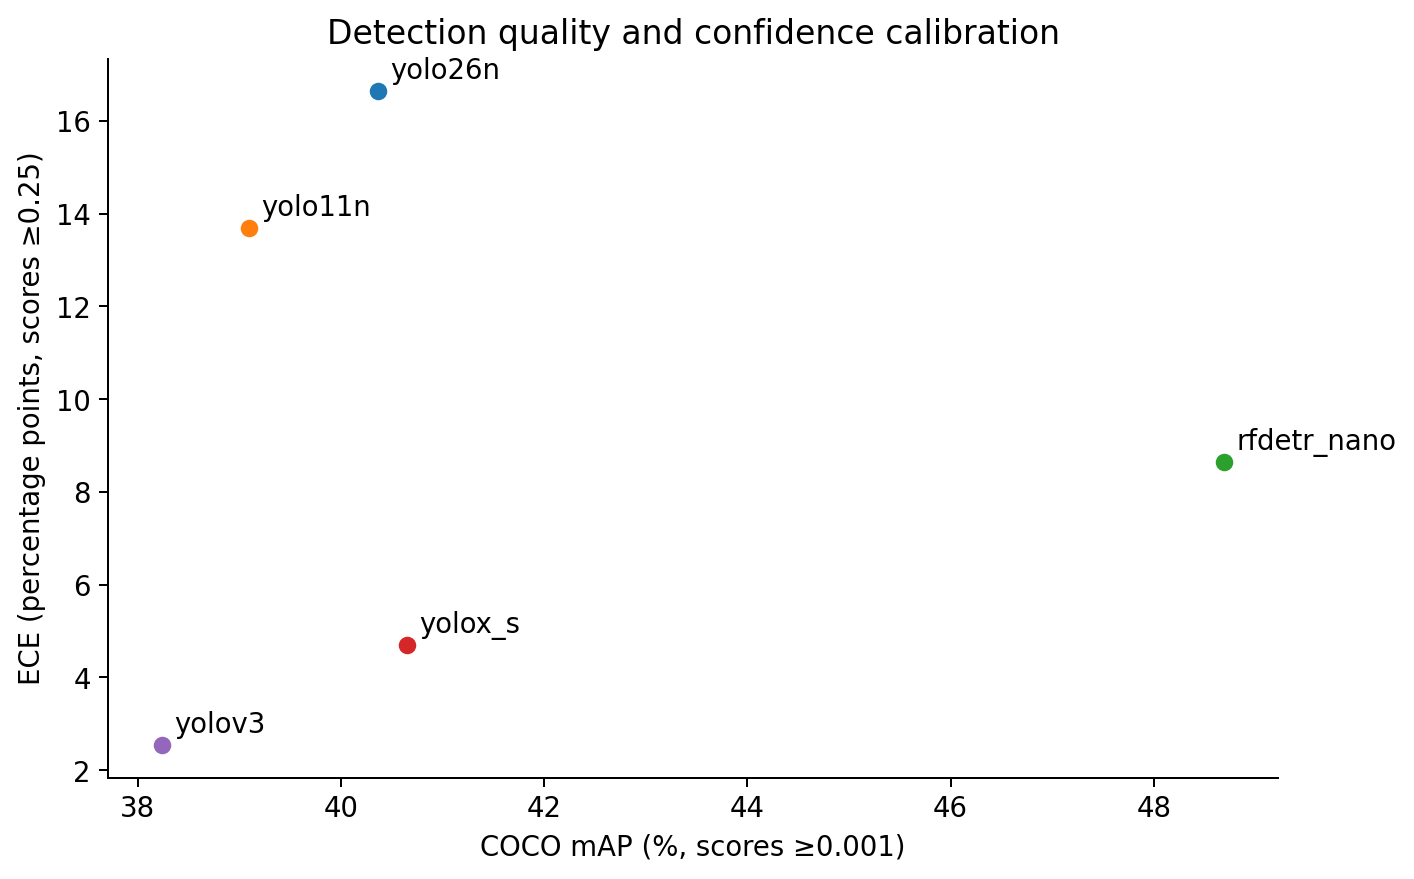
Calibration describes how closely confidence scores match actual results. For example, among detections scored near 0.80, about 80% should be correct. A model can find objects well and still give misleading scores. Detection quality and confidence reliability are separate things.
In this test, a detection is correct when it names the right class and its bounding box is placed correctly. The resulting and the original bounding box overlap measure is intersection over union, or IoU: the shared area divided by the total area covered by both boxes. The required IoU is at least 0.50.
Guo and colleagues showed that a simple temperature adjustment could improve confidence in neural network classifiers. Their work was the inspiration for this test.
Models and data
The benchmark compares YOLO26n, YOLO11n, YOLOX-S, RF-DETR Nano, and original YOLOv3 COCO weights. The results only cover five specific checkpoints, not whole detector families.
The 5,000 COCO val2017 images were split using seed 42: 1,000 to choose the model to correct, 1,500 to fit and compare corrections, and 2,500 for the final test. The image IDs were saved separately to make the split repeatable.
Each model kept its usual image processing and box filtering. Inference used FP32, kept scores of at least 0.001, and saved at most 100 detections per image. The main calibration comparison uses original scores of at least 0.25. RF-DETR output slots without a COCO class were recorded separately and excluded.
How far off were the scores?
Expected calibration error, or ECE, summarizes how closely confidence scores match actual correctness. For example, among detections assigned about 80% confidence, roughly 80% should be correct. If only 60% are correct, the scores overestimate reliability by 20 percentage points.
To calculate ECE, confidence scores are divided into 15 equal-width groups. Within each occupied group, average confidence is compared with the correct detections. Both overconfidence and underconfidence count as errors, so they do not each other out.
These gaps are then averaged, weighted by the number of detections in each group. A group containing 10% of all detections with a 20-point gap contributes 2 percentage points to the total ECE. Larger groups therefore influence the result more than smaller ones.
Lower ECE means confidence agrees more closely with observed correctness across these groups. An ECE of 1.31 percentage points describes a small weighted average mismatch, but it does not mean that only 1.31% of detections are incorrect. ECE also depends on the grouping, so it is a useful summary rather than a guarantee that every score range is equally reliable.
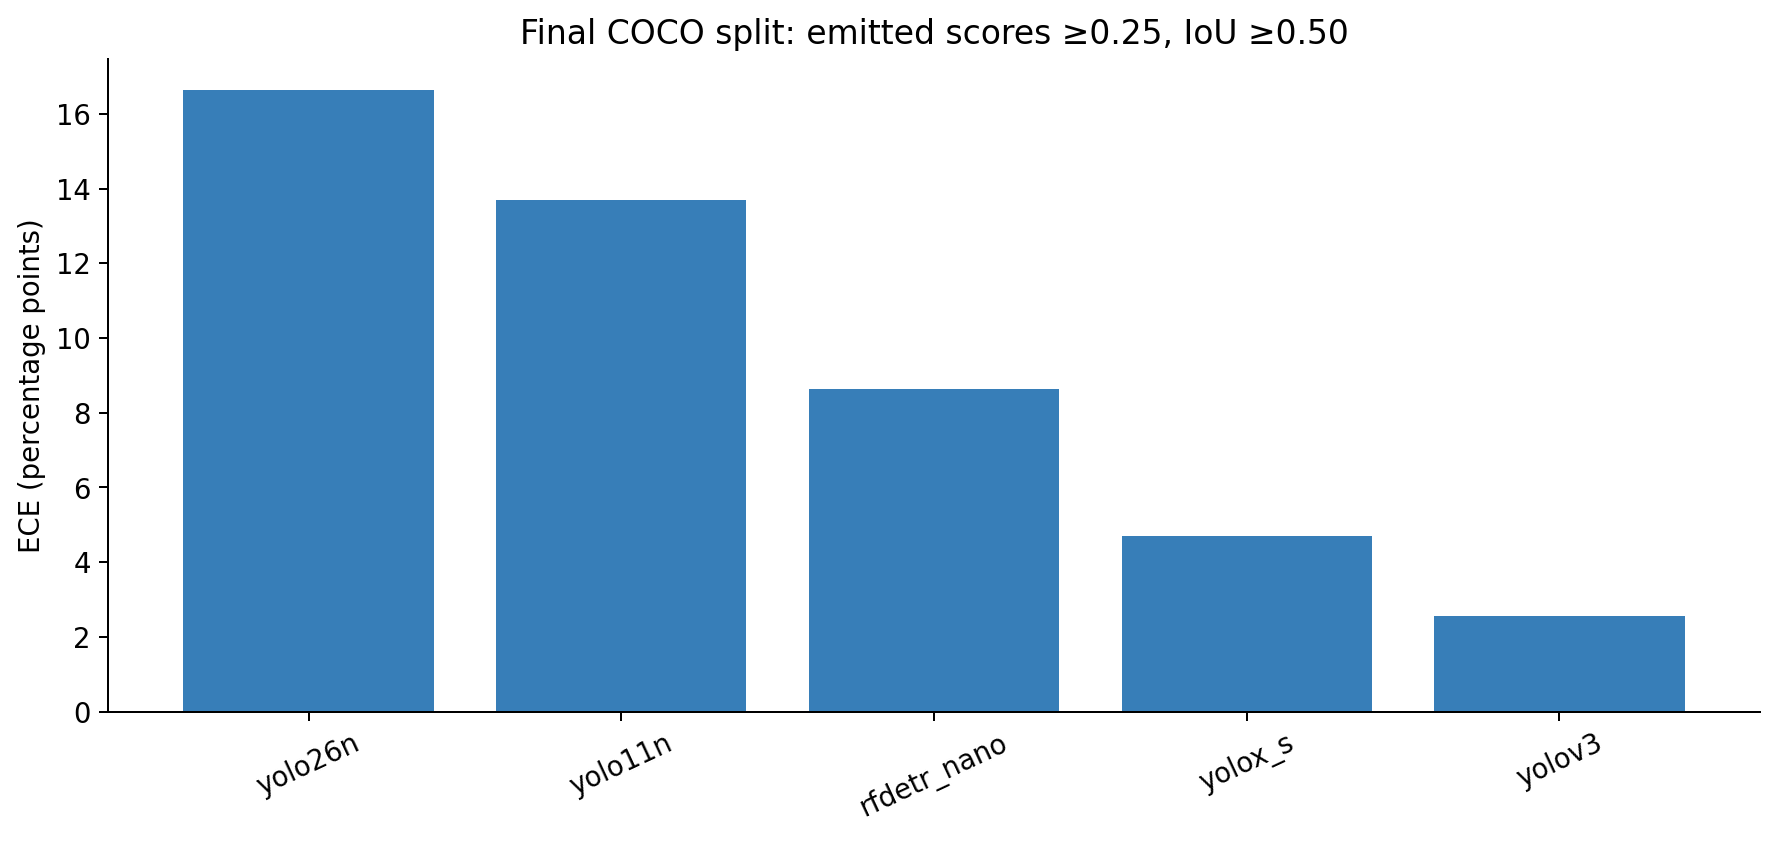
YOLOv3 had the lowest final ECE: 2.55 percentage points. This resembles Guo’s finding: newer models can be less calibrated than older ones, even when detection or classification improves.
Why does this happen? Guo linked poorer calibration to larger networks, batch normalization, and weaker penalties on large weights. Training can also increase confidence without improving correctness. However, Guo’s newer classifiers were often overconfident while YOLO26n was underconfident. The similar pattern concerns calibration error, but the direction mismatch.
A small correction to fix the calibration
Among YOLO26n, YOLO11n, and RF-DETR Nano, YOLO26n had the highest ECE on the selection images. That model was chosen for implementing the calibration correction.
Two methods were tested. Temperature correction uses sigmoid(logit(score) / T), with positive T. Platt correction uses sigmoid(a * logit(score) + b), with positive a. Both remap the score while keeping its order. Temperature correction here acts on the detector’s output score; it is an adaptation of Guo’s classifier method.
Two confidence corrections were fitted using 1,500 calibration images. Each method was repeatedly fitted on some images and evaluated on separate images. Platt correction performed better, so its final parameters were fitted using all calibration images. With this correction, an original confidence of 90% becomes approximately 98.1%.
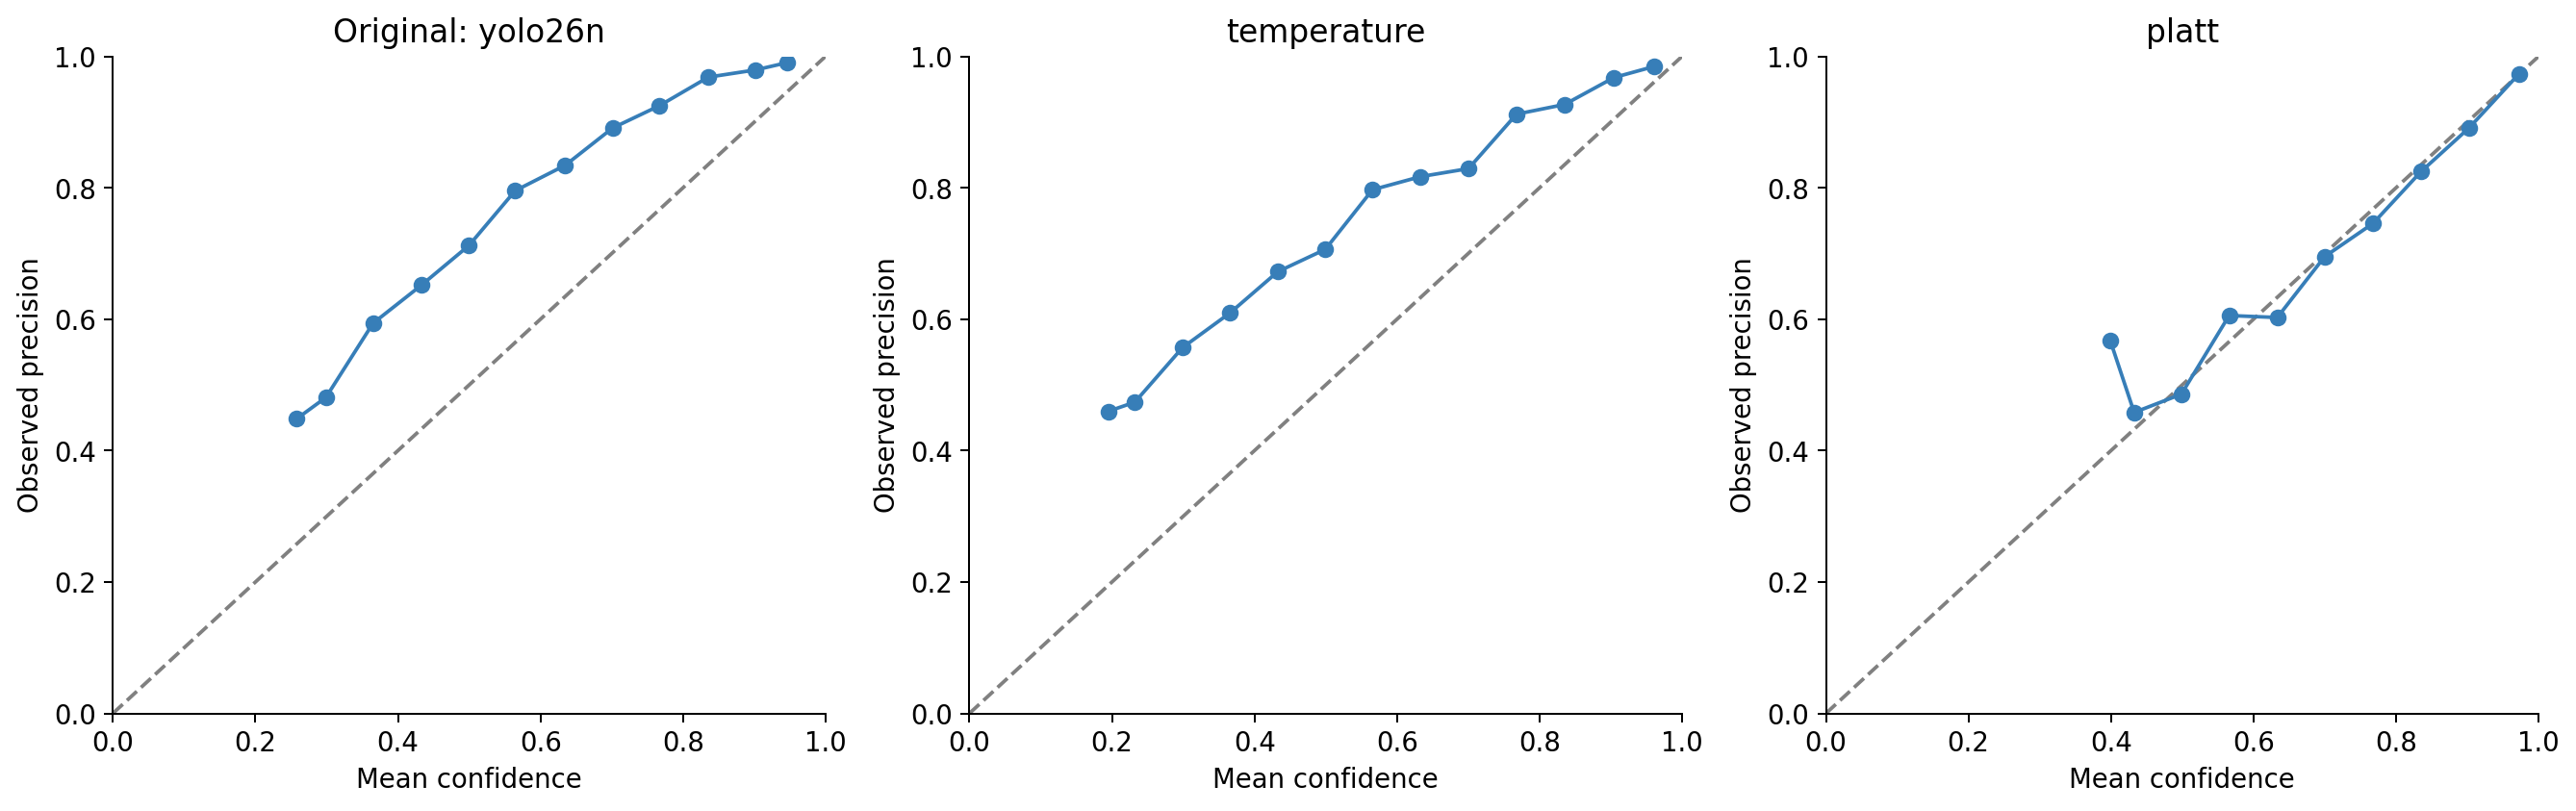
On this graph the first Platt point sits above the diagonal because it contains only 37 detections: their average corrected confidence is about 40%, but 21 of them were correct, giving 57% precision.
The correction was then evaluated on 2,500 separate test images. ECE fell from 16.64 to 1.31 percentage points. NLL also improved, from 0.4936 to 0.4103.
Resampling the test images 1,000 times produced a 95% interval corresponding to an ECE reduction of 13.77–16.20 percentage points. This supports an improvement on this test population. The same 10,893 detections were evaluated before and after correction: the boxes and detection accuracy remained unchanged, while their confidence scores became more reliable.
| Corrected score threshold | Retained detections | Precision |
|---|---|---|
| All original detections | 10,893 | 78.45% |
| ≥ 0.50 | 9,529 | 82.98% |
| ≥ 0.70 | 7,317 | 89.93% |
| ≥ 0.80 | 6,115 | 93.25% |
| ≥ 0.90 | 4,594 | 96.30% |
| ≥ 0.95 | 3,269 | 97.80% |
The model did not become more accurate, but it's predictions became more reliable.
Using this in practice
Fit the correction using images that reflect the intended use, then evaluate it on a separate set. Specify the confidence threshold and what counts as a correct detection, since both affect the results.
This test evaluates confidence only for detections the model produced; it does not account for missed objects. Detection calibration research also considers box location and size. Calibration may vary across cameras, object classes, and object sizes, so these conditions deserve separate checks. A calibrated score gives a more reliable estimate of correctness, but cannot guarantee that any individual detection is right.